Getting started
What is Missinglettr?
1 - Set Up your Missinglettr Workspace
2 - Connect your Social Media Account
3 - Connect a Content Source
4 - Set up branding for your campaigns
5 - Set up Schedule Templates
6 - Set up Dates and Times for my posts
AI features in MissingLettr
Campaigns
Errors on campaign creation
AI Settings
What is a campaign?
Author specific campaigns
Creating and editing content templates
Customize the font for your branding
Customizing Quote Bubbles
Edit an Active campaign
General Settings
How to choose which page or group Missinglettr should send your campaign to
Image guidelines for campaigns
Manual Campaigns
Media assets download
Regenerate a campaign
UTM Parameters support
What are Drip Campaign goals?
What will happen to my schedule if I pause and then re-approve a campaign?
Which URL shorteners can I use for my campaigns?
Why do most of my posts use the first time slot?
Social media
General
Character limits for different platforms
How to delete a social profile
Which social media accounts can I connect?
Why am I being asked to reauthenticate my social profile?
X
Having problems connecting to Facebook?
I can't connect my Facebook GROUP
I've connected my Facebook PAGE, but nothing is posting
My Facebook timeline is not available for selection
My plain text Facebook post is being published with a link
Medium
Having problems connecting to LinkedIn ?
How to reauthenticate LinkedIn
My LinkedIn company pages are not available for selection
Problem connecting to LinkedIn
Bluesky
Mastodon
Let's get technical
Integrations
Connecting your RSS feed to Missinglettr
Content from my blog posts aren't being extracted
How Google Analytics treats our shortened URLs
How to add your Youtube channel
No content found for a campaign ? Here’s how you can help us recalibrate your webpage
Setup an RSS feed
What's an RSS feed?
Sites
Can I change permissions for my team members?
How can I add/remove team members?
How to add a site
How to remove a workspace
My site's URL isn't being recognized
Security
Payments and billing
Common Questions
Does Missinglettr work with languages other than English?
How long will I wait for a response from Customer Support?
I have a feature suggestion, where can I submit it?
I want to exercise my rights under GDPR
Is Missinglettr GDPR compliant?
Which blogging platforms does Missinglettr work with?
Affiliate
Curate
Curate Auto-Schedule
Curate Quality Guidelines
Do you guarantee a minimum number of shares via Curate?
How likely is it that my Curate content will be shared?
Why is Curate reporting a problem loading my URL?
Analytics
Video Presentation
Table of Contents
- All Categories
-
- Analytics
Analytics
Intro
Analytics provides insight into how your campaigns are performing - i.e. how many clicks they have gathered over a specified period of time. Apart from that, you can see which days of the week and times of the day have seen the most clicks.
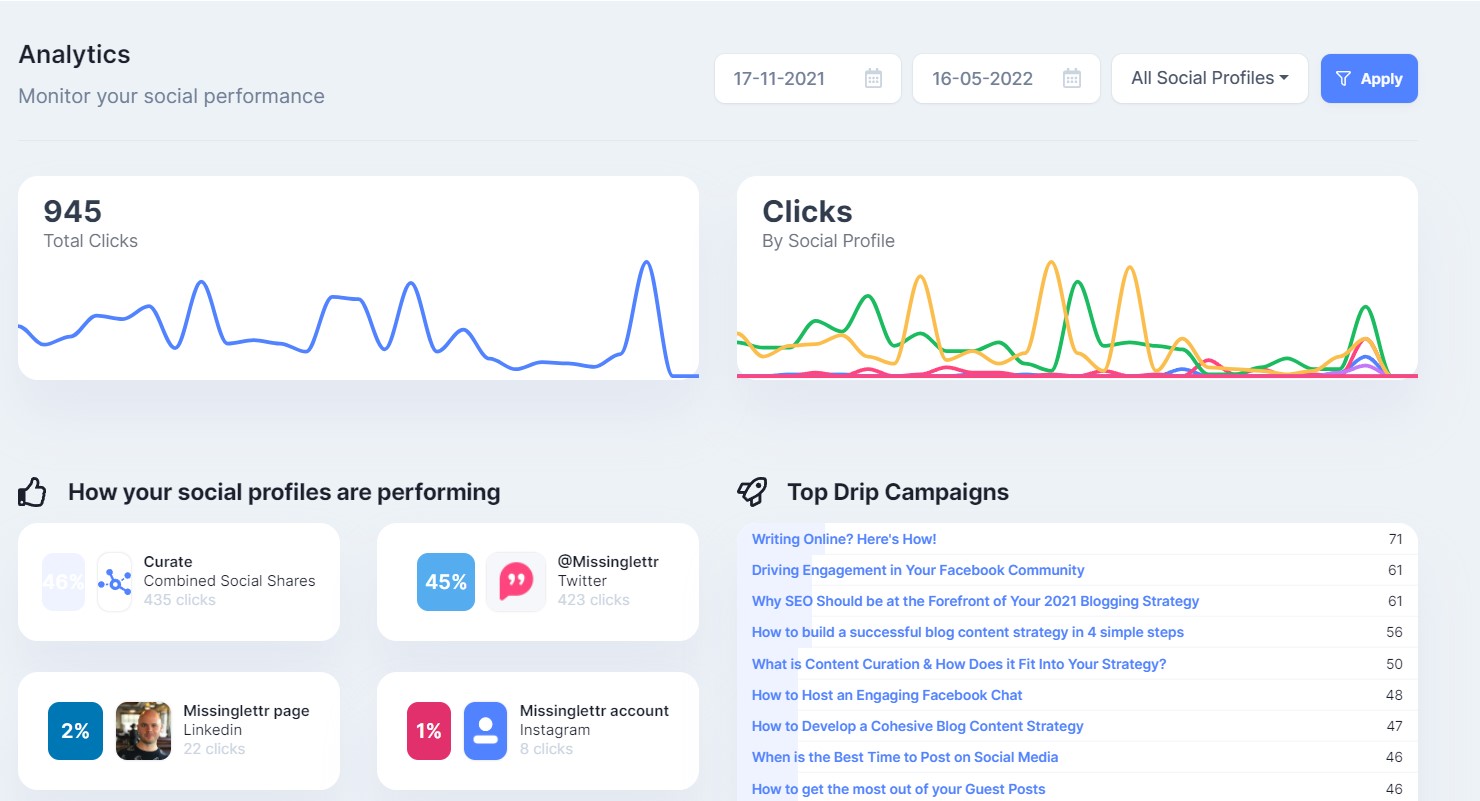
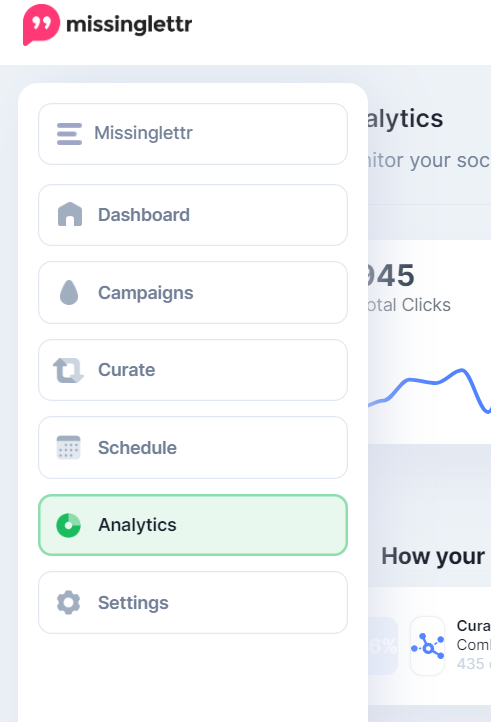
You can access analytics from the Analytics menu item:
lttr.ai stats
As described here, with lttr.ai we have much greater insight into how individual campaigns and posts are performing, given the parent link/child link architecture we employ throughout campaigns using lttr.ai, hence the difference in analytics we can provide for other shortening providers.
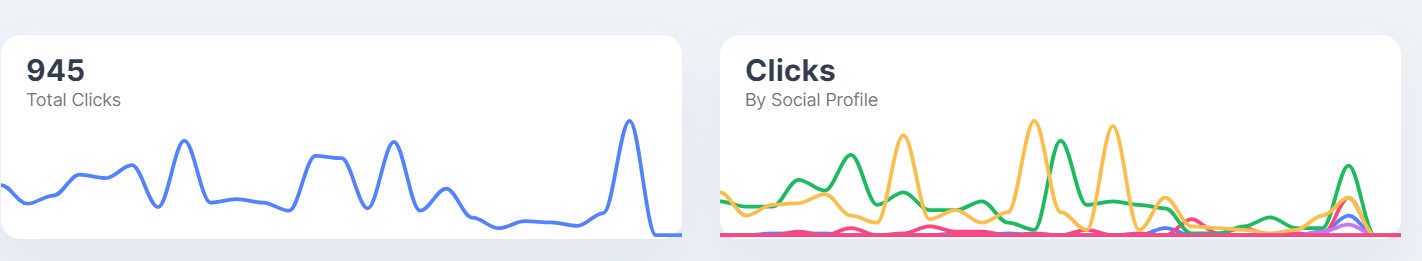
Charts
There are a few key elements (charts) visible in the analytics tab:
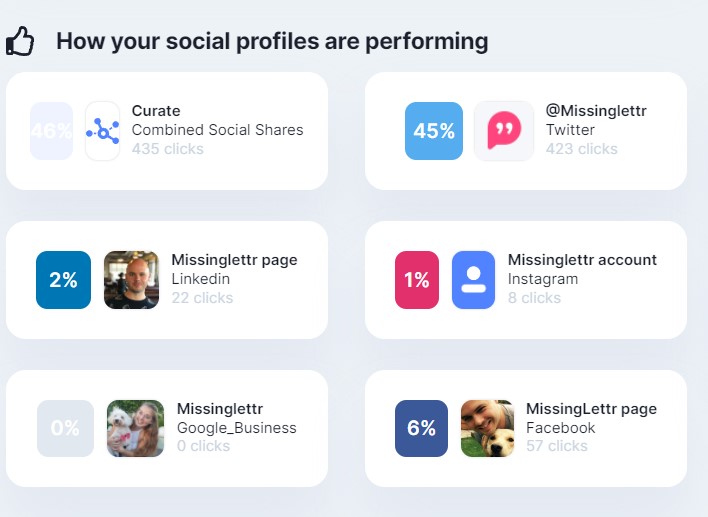
How your social profiles are performing - displays the total number of clicks collected across all campaigns for a defined time period:
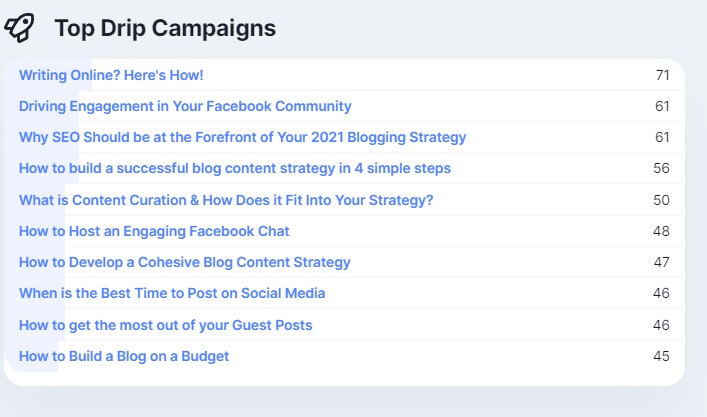
Top drip campaigns - displays the campaigns which were active in the indicated period, sorted by the number of clicks each has collected:
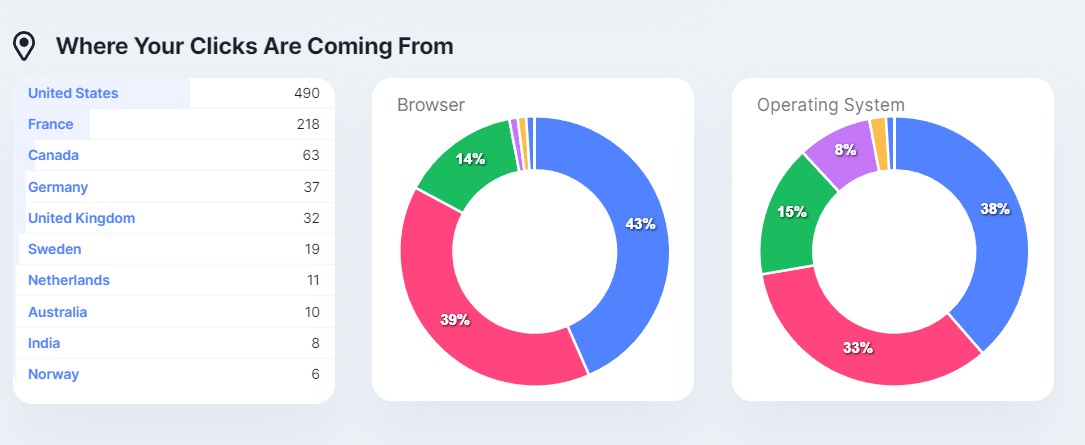
Where your clicks are coming from - breakdown of clicks collected by country, browser, and operating system.
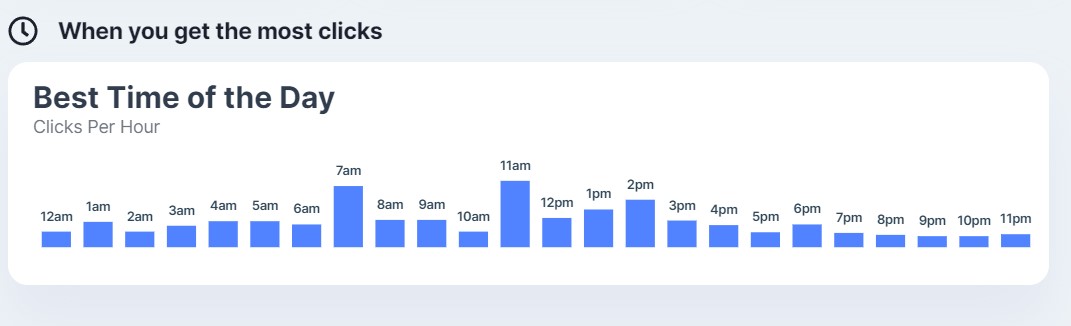
When you get the most clicks- displays the distribution of engagement by hours for the indicated period:
Filters
Filters allow you to fine-tune what Analytics displays - filter by time period and social profiles to take a deeper look at your results.
In terms of limitations - there are none - however, if we don't have any data for the period of time you have selected, we will display a message that no data is available for the selected period, in which case you should expand the scope of your filters.